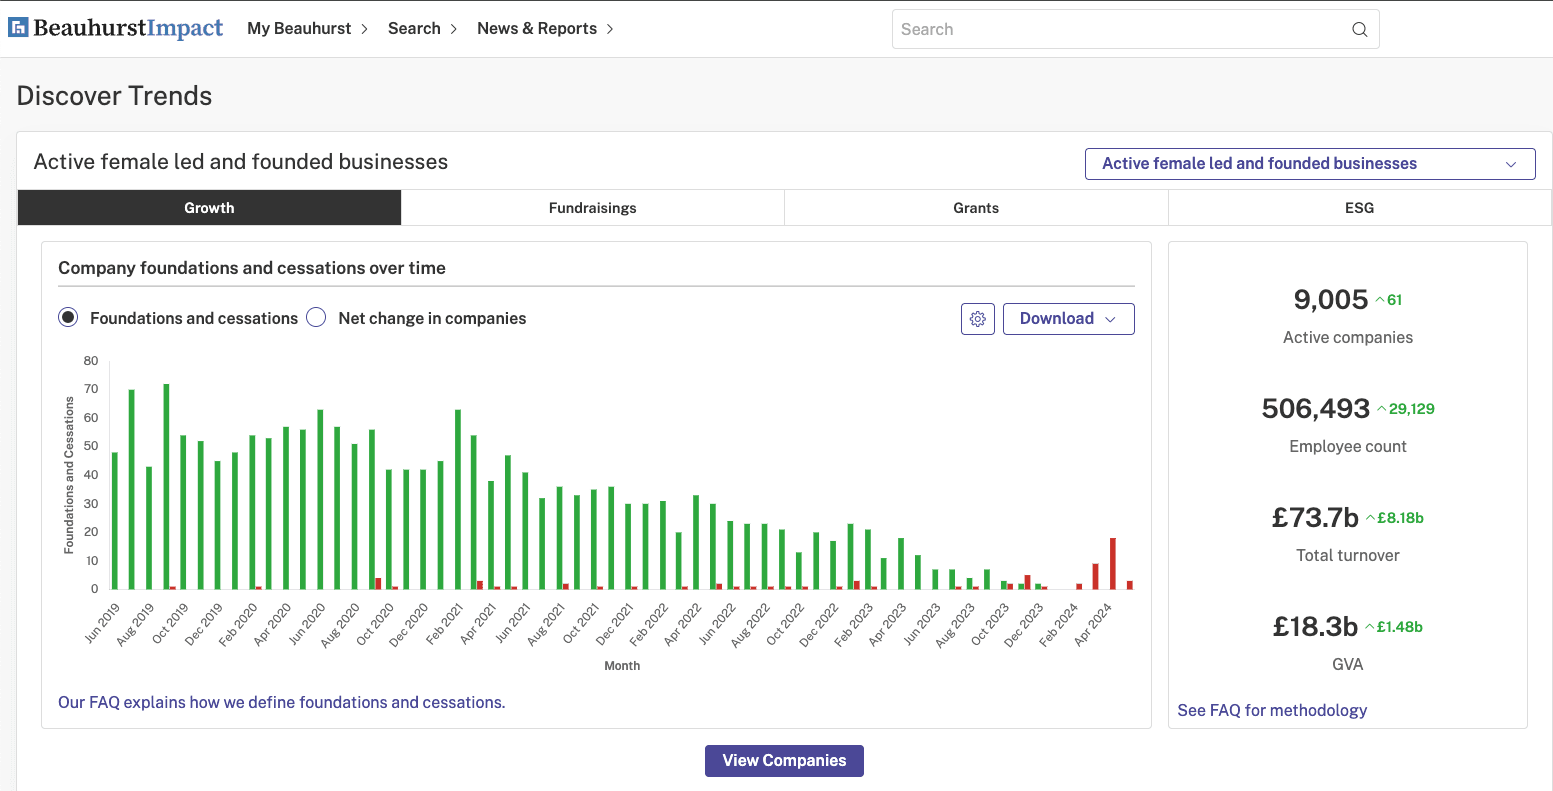
GVA (Gross Value Added) is a vital metric for demonstrating a company’s contribution to the UK economy, at both national and regional levels. Local councils in particular use GVA as a quantitative measure to justify investment and support policy-making initiatives.
The ONS (Office for National Statistics) dataset — a key source for many — is only published once a quarter and the deepest analysis available for GVA is by region. And whilst this is useful for a macro look at the national economy, it can lack granularity for many.
So, in 2024, we launched GVA data on the Beauhurst platform, enabling decision-makers to discover GVA down to individual company level.
Why our GVA data is making a difference
For our local government clients, our GVA dataset is already changing the game. It enables teams to track the effectiveness of interventions on a company or region’s success.
And when paired with our industry classification system — covering over 225 industries — you can reveal which industries in your area are the greatest contributors to the local economy.
Universities can also use Beauhurst to track the GVA of spinouts, and use this data to support knowledge exchange and commercial activities.
How we calculate GVA
At Beauhurst, we calculate GVA using the GVA(i) formula, also known as the ‘income approach’. This means adding employee wages + operating profit (EBIT) + depreciation + amortisation together to deliver a final figure.
By comparison, the ONS adds the sum of all income from employment (compensation of employees), and other income generated by the production of goods and services and uses this data to deliver very good regional analyses.
The key difference here is that the Beauhurst method of calculating EBITDA data by company gives a much clearer picture of a company’s direct value to the local economy. And, as a result, we’re able to algorithmically calculate GVA when a company files its financials.