At Beauhurst, we’re invested in understanding the company ecosystem across the UK. Our data spans the length and breadth of the nation, across every council, so we have a unique view of what’s happening and where.
This year, we undertook deep analysis of UK councils to create The Local Growth Index, the UK’s first-ever local business data encyclopedia. In it, we put together a data profile on every local authority across the whole of the UK — that’s 361 councils. In our book, you can discover what every local council is doing on essential matters such as growth, innovation and trade.
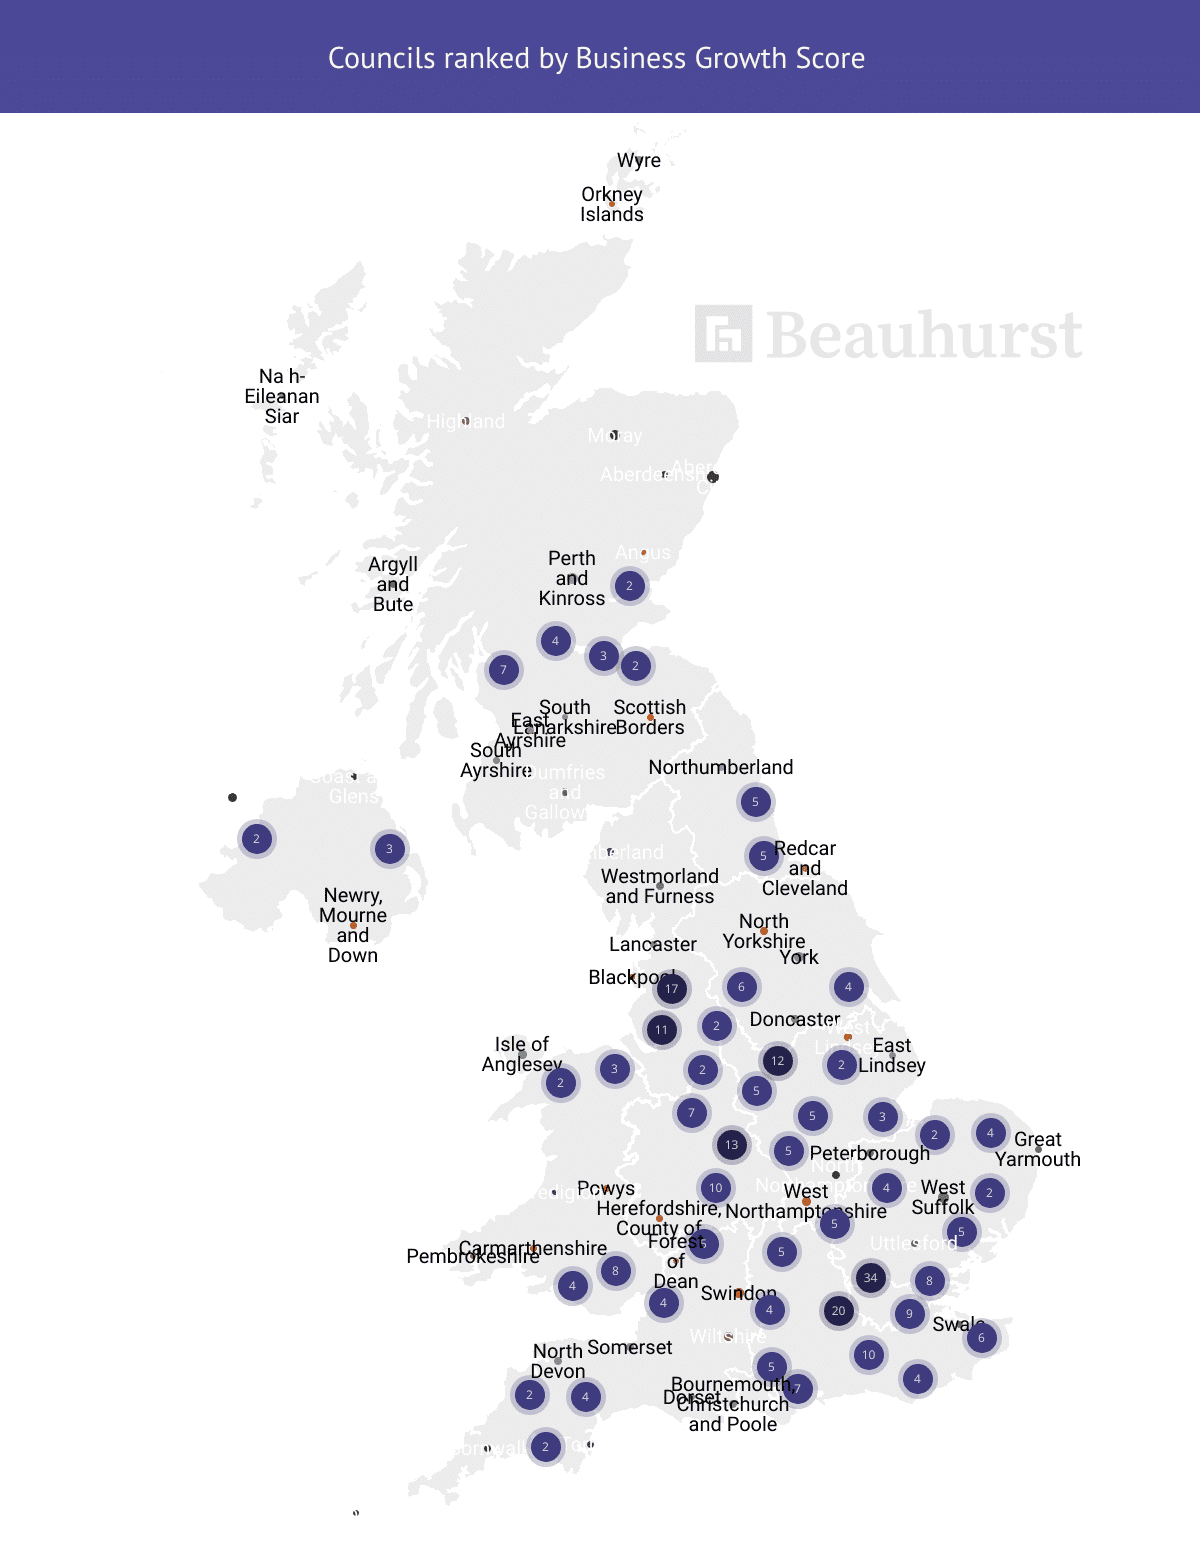
We also used this data to rank all the councils using a Business Growth Score. From this analysis, we spotted something unexpected in the distribution of wealth across UK councils. But first thing’s first, let’s see what went into creating the Business Growth Score.
What is a Business Growth Score?
The Business Growth Score is calculated using a Beauhurst-designed formula. Several metrics are combined to generate the final Business Growth Score, using data between 1 May 2023 and 1 May 2024. The metrics used are:
Number of new companies: The number of new companies established.
Number of scaleups: The number of companies that have achieved significant growth.
Number of fundraising events: The number of successful fundraising events completed by companies in the area.
Number of grantees: The number of companies that received grants.
Number of employees: The total number of employees in the area.
Number of active companies: The number of active companies as of 1 May 2024.
To accurately reflect business growth, the scoring formula takes into account the overall business activities in relation to the number of active companies.