Diversity fuels growth and innovation–that’s a fact. And in order to spot opportunities for change and improve diversity, we need to be able to report on the current state of play. We’ve previously published research on gender and age diversity in the high-growth space. But now we’ve made it easier than ever for you to replicate this with the Beauhurst platform, and track ongoing progress in different sectors and regions.
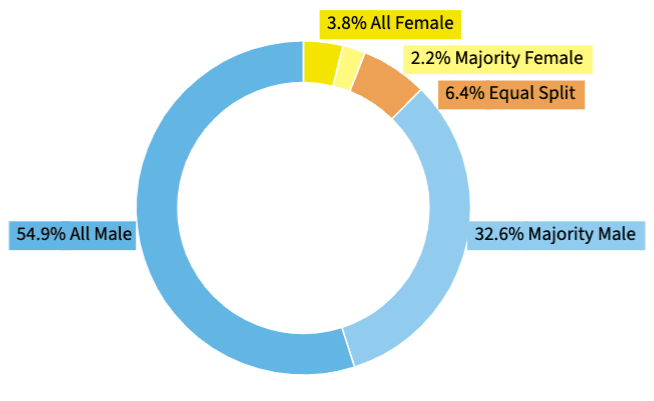
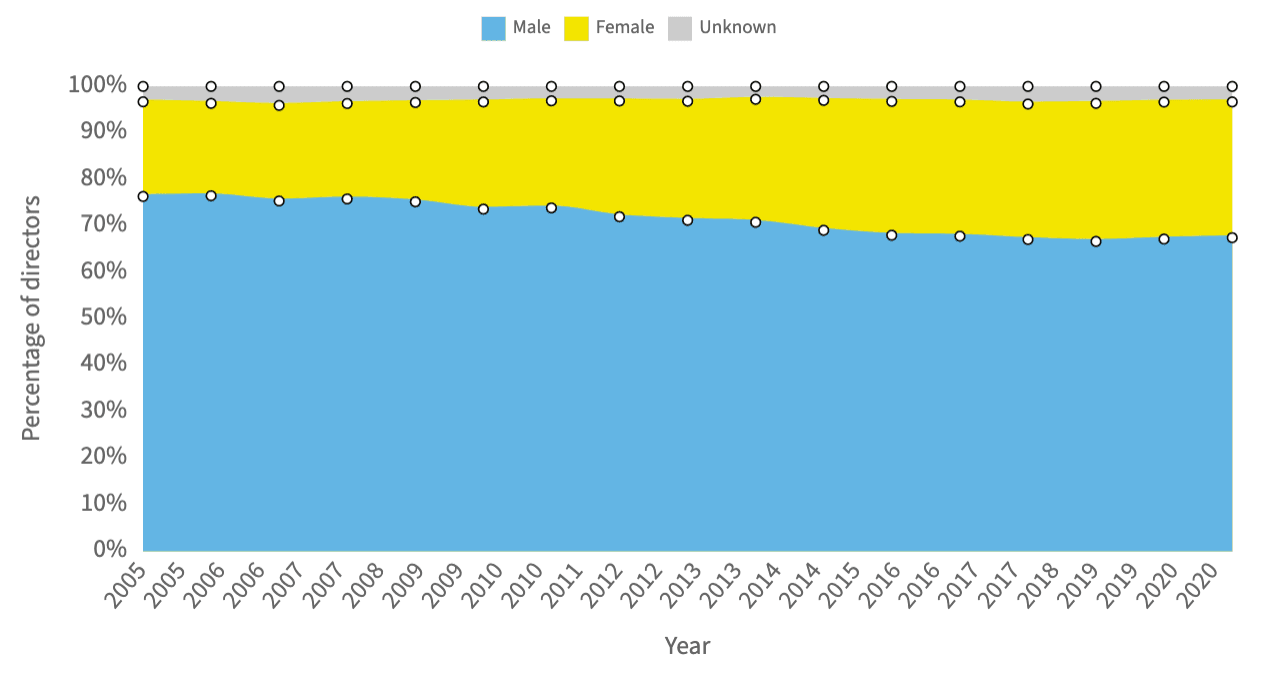
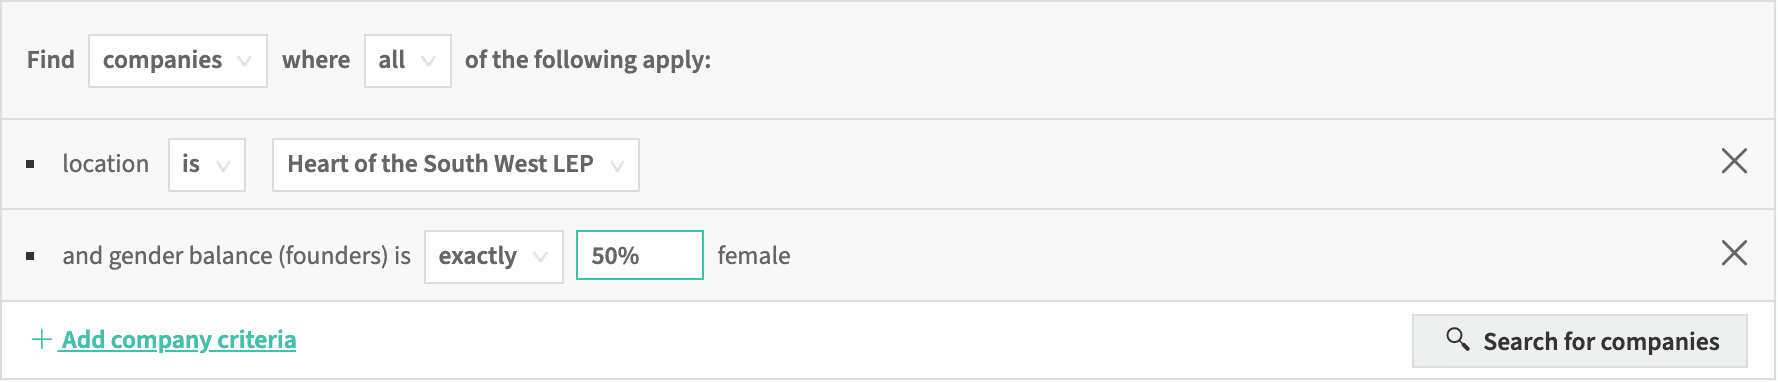
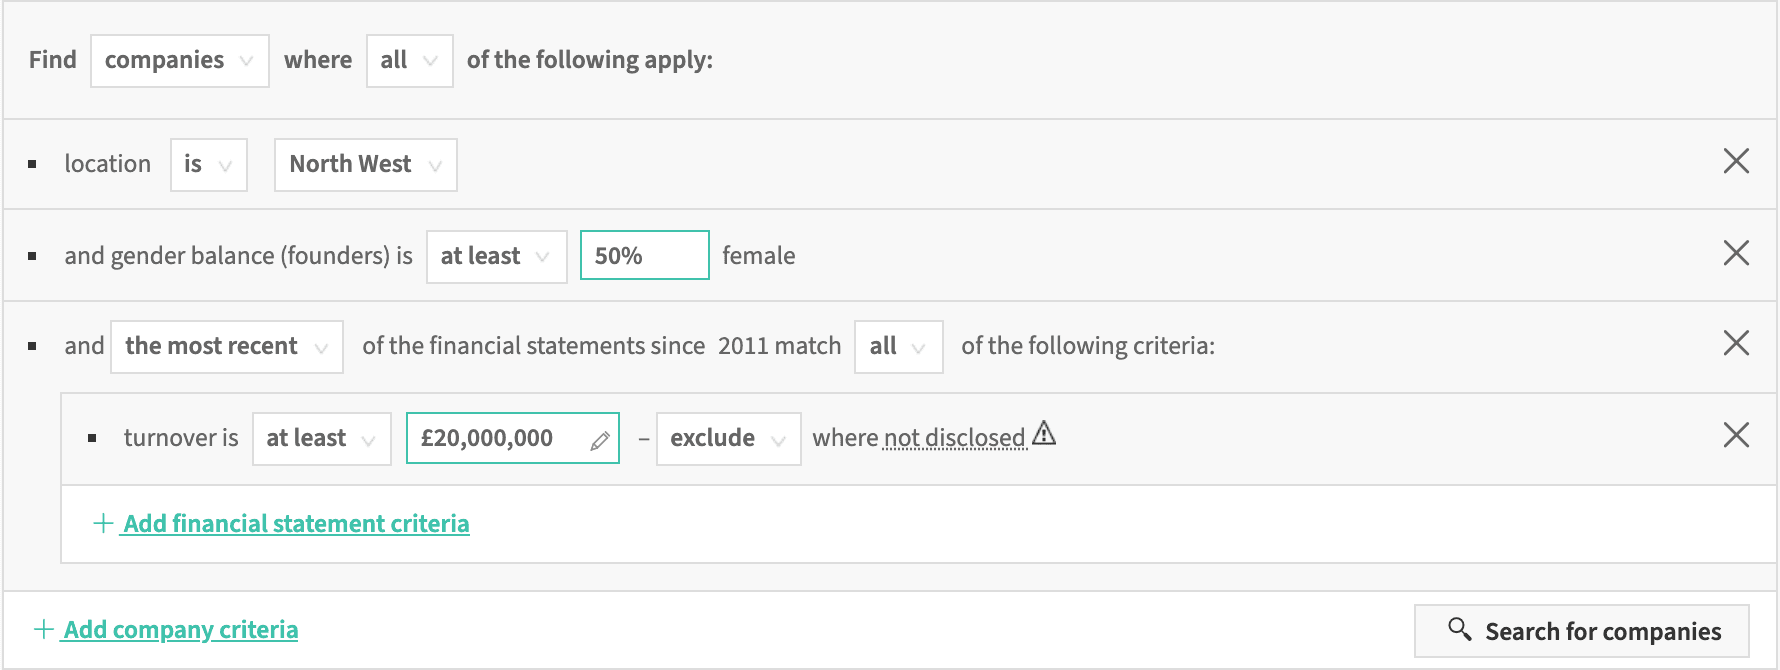
We’ve added visualisations of founder, director and C-suite demographics, across every high-growth company in the UK. You can also search across this data, and target companies with a specific gender balance of founders, directors, or senior leadership.
These new charts and search criteria allow you to:
- Easily visualise gender and age diversity in your region, industry, or even within your portfolio
- Identify opportunities to improve inequalities in your portfolio, by targeting organisations that have a specific gender balance
- Target female-led businesses, with information on grants and support available in your area
- Measure the economic impact that female-led businesses have had on your region
- Build target lists for events or diversity and inclusion initiatives
- Understand how female-led startups have succeeded in traditionally male industries, and create case studies of the most successful companies
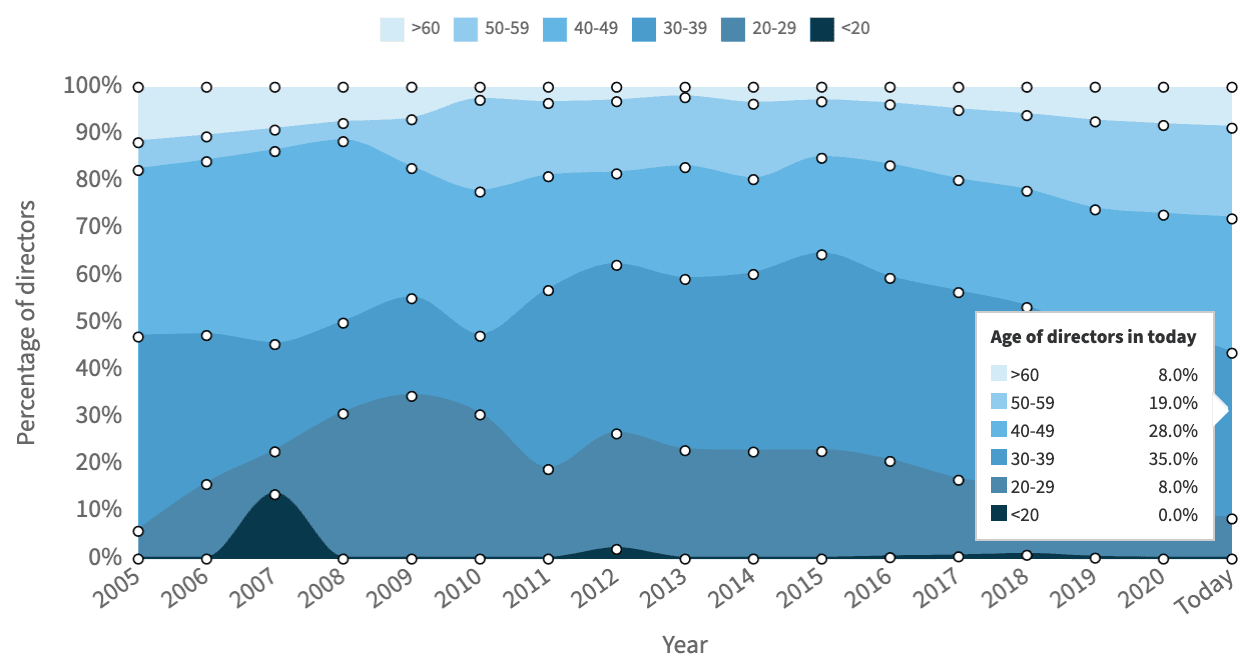
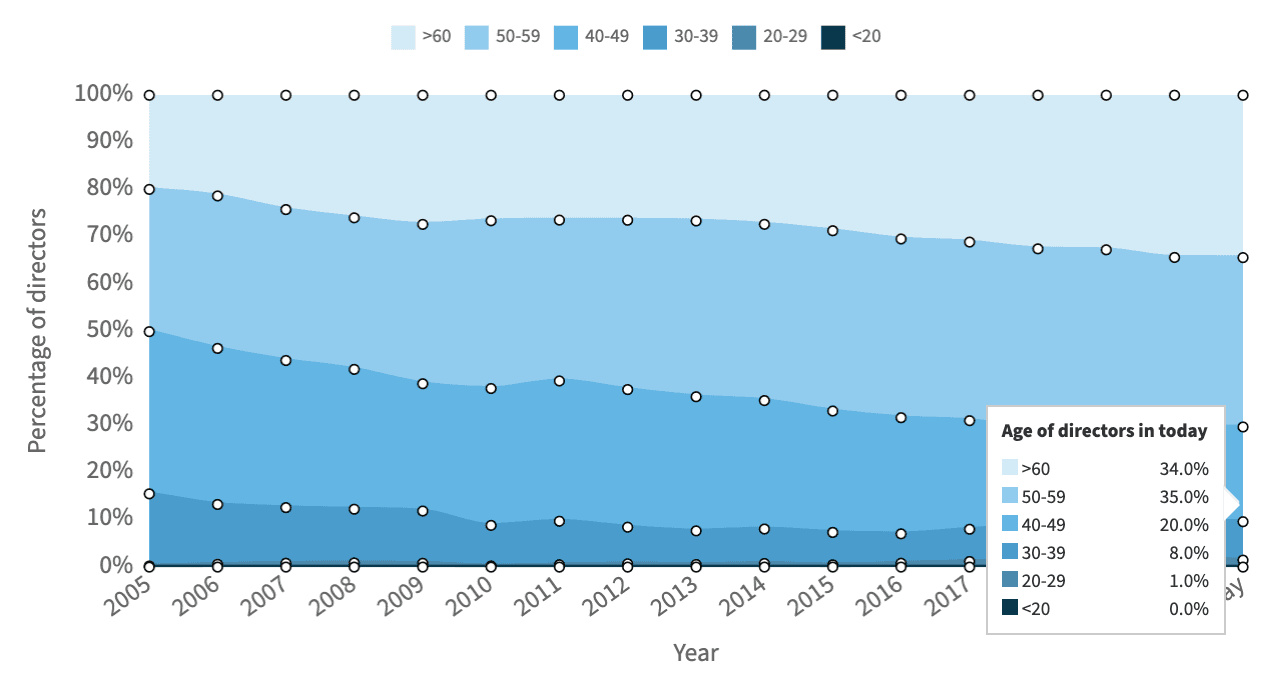
- Compare industries by director ages, and see which are attracting younger talent
Here, we explain all of the new graphs, and highlight some hand-picked demographic insights.
Visualising gender diversity across cohorts of companies
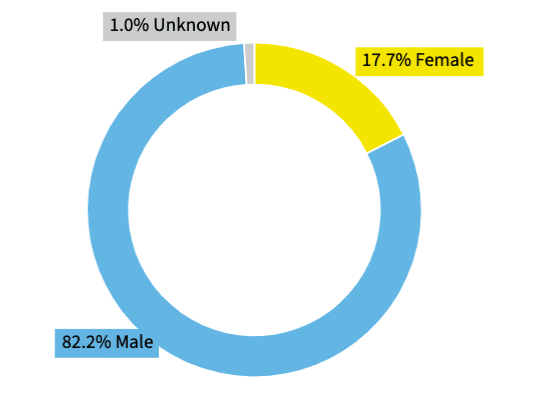
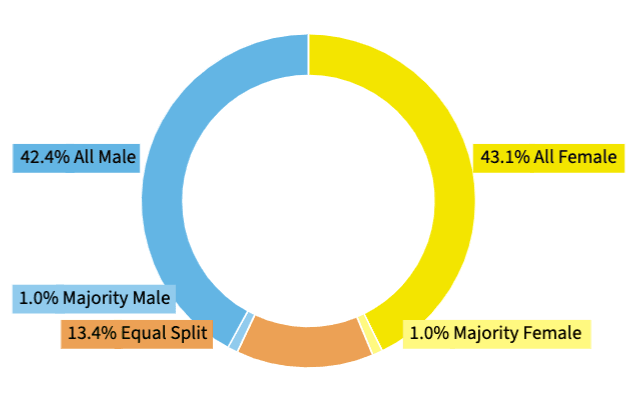
The new gender balance chart allows you to understand the makeup of companies you’re looking at through our Advanced Search, Collections, and Explore features.
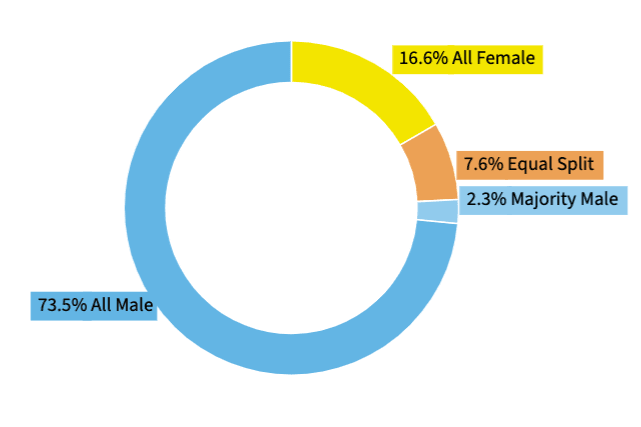
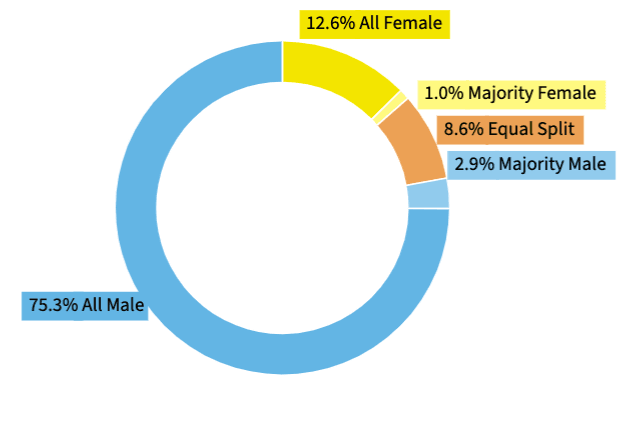
For example, you can now easily see that 16.6% of high-growth companies in the North East have an all-female founding team, compared to just 12.6% of those in London.
Gender balance of high-growth companies in the North East (by founders)