Think of Britain and your mind will probably conjure up images of the White Cliffs of Dover, Brighton Rock or even the Blackpool Tower. Coastal landscapes and communities are fundamental to our national character. However, despite being an island nation, the “coast” is one of the most overlooked parts of the UK economy.
It is also one of extremes. At one end of the spectrum we see bustling port cities like Bristol, Newcastle and Liverpool which are key drivers of regional economic growth. On the other, coastal communities are often statistically likely to have more crime, poorer health outcomes and higher levels of income deprivation than their inland neighbours. There is also a striking disparity in economic outcomes across coastal communities, and the data behind it is more complex than it first appears.
Last month, the Beauhurst Insights team published a report with Ashfords looking at this topic. Today we wanted to dig a little deeper into the data to understand what’s actually driving that gap and why some coastal communities pull ahead while others fall further behind.
Equity investment and the coastal funding gap
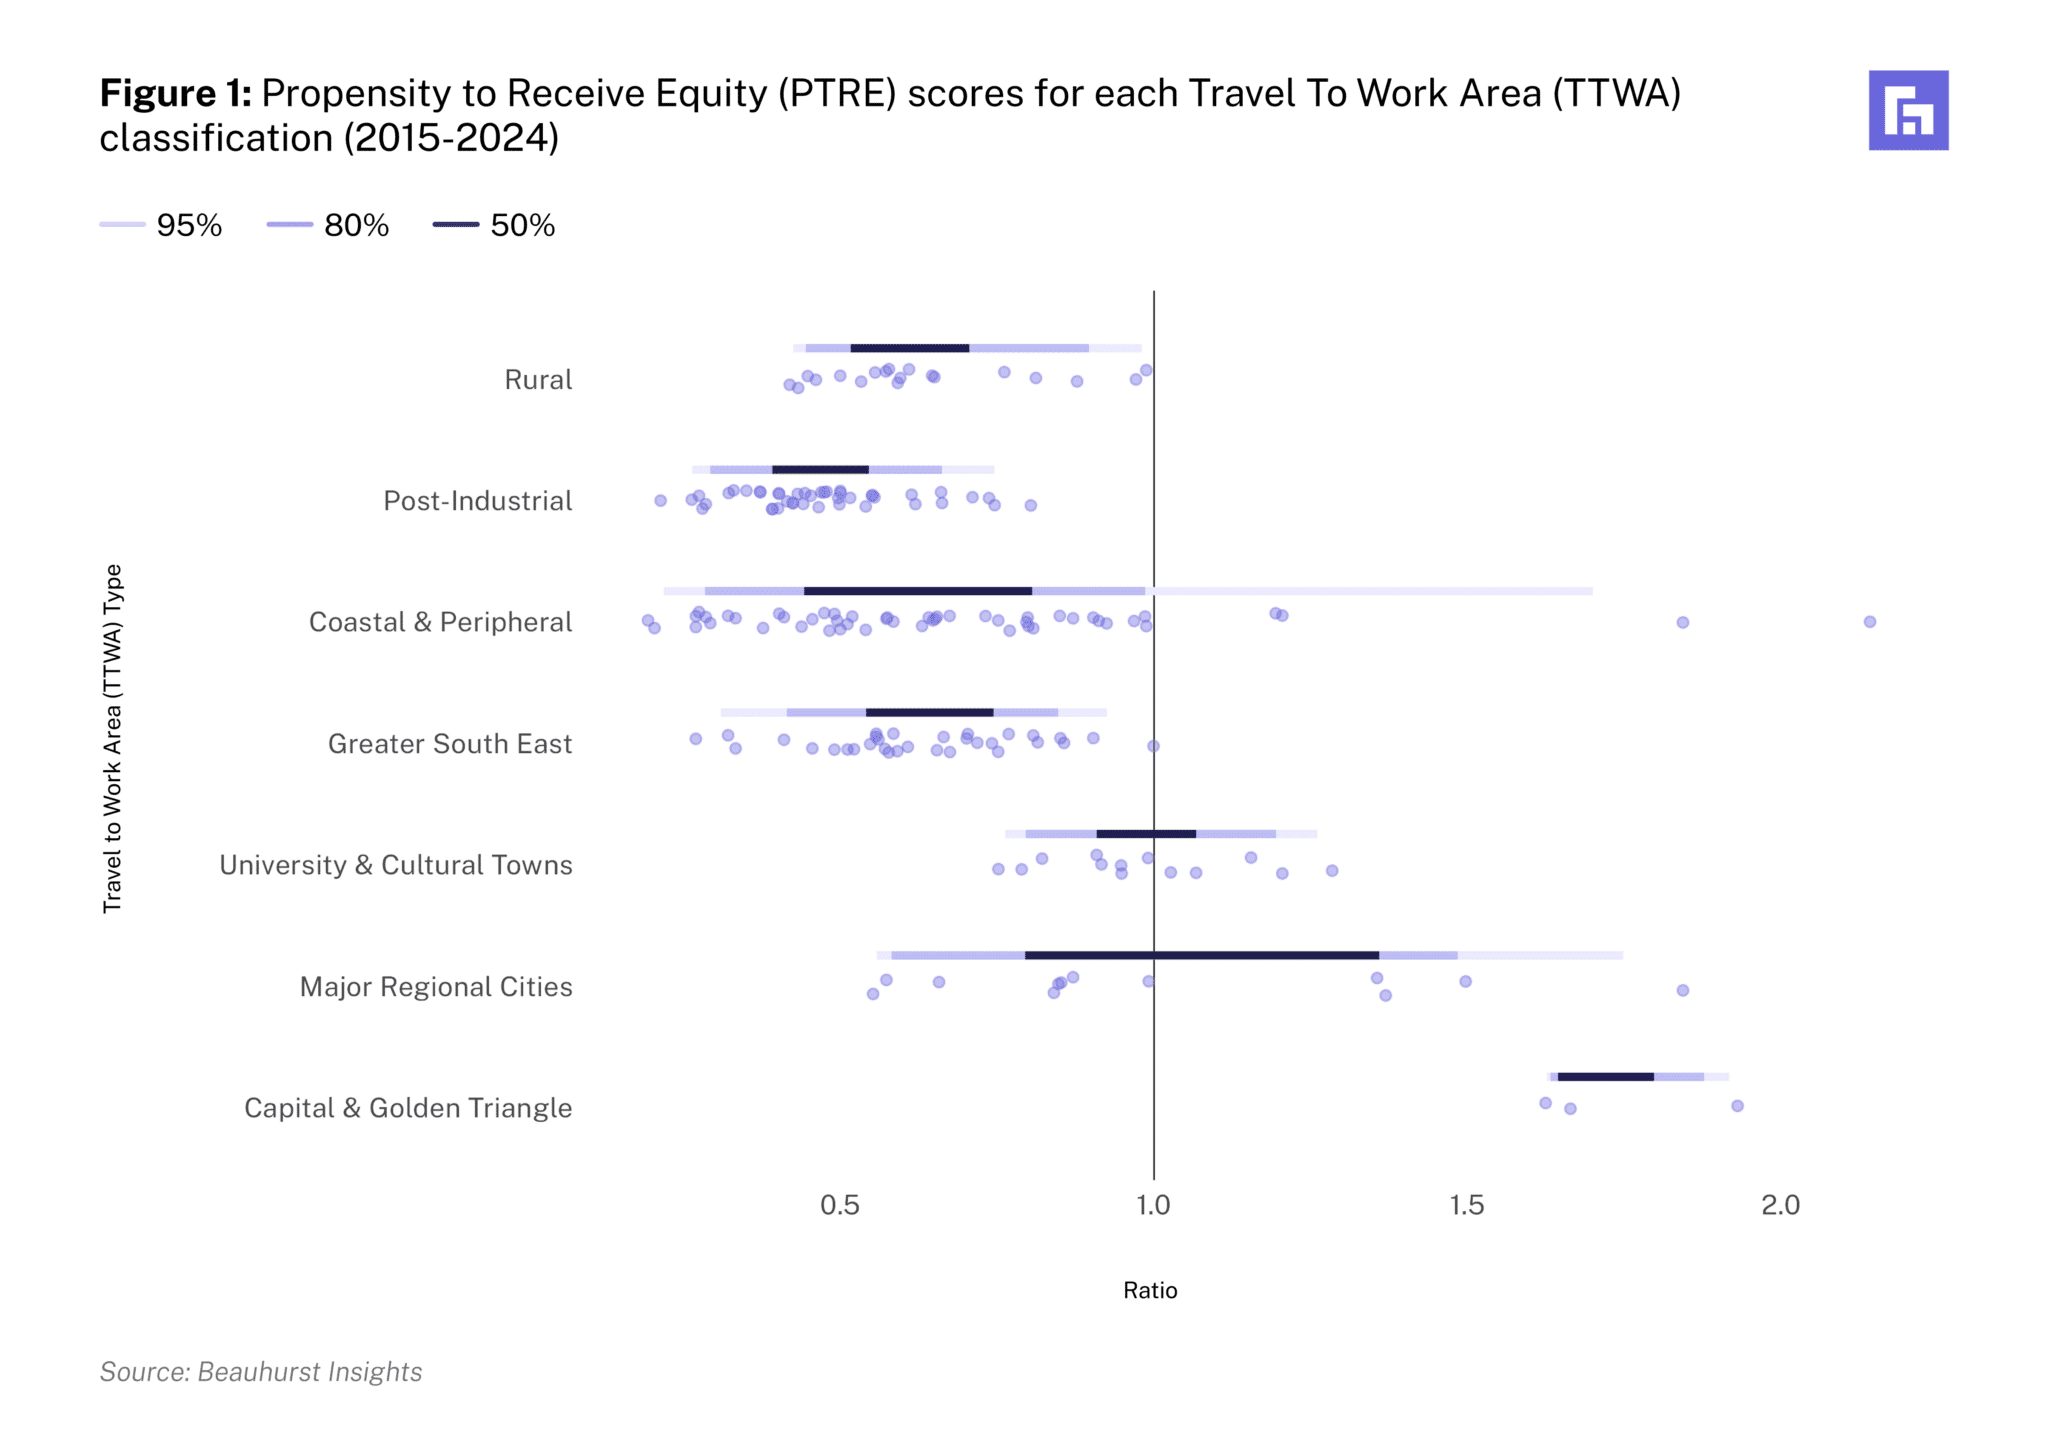
A good place to start is looking at equity investment. Rather than simply counting deals (which skews any analysis towards London), we developed a Propensity to Receive Equity (PTRE) score for every firm based on its sector and age across Britain’s Travel To Work (TTW) areas. This gives us a sector-adjusted baseline: a ratio of actual investment relative to expected investment. A score of 1.0 means a locality is getting exactly the same equity its economic composition predicts.
Here is where things get interesting. When we apply this sectoral adjustment, London’s advantage barely moves. The adjusted ratio correlates 98% with the raw, unadjusted measure. In other words, London’s equity dominance is not explained by having more investible industries. It is happening instead within sectors. London’s software companies raise more than Sunderland’s. London’s biotechs raise more than Hull’s. Holding firm characteristics constant, a company in a ‘Coastal & Peripheral’ TTW area is 62% less likely to ever receive equity than a comparable London firm.
Now look at where ‘Coastal & Peripheral’ sits in Figure 1. Every other area type clusters in a recognisable range. Post-Industrial sits low. Capital & Golden Triangle bunches tightly at the top. Coastal & Peripheral sprawls from 0.3 to beyond 2.0 (the widest distribution of any category in the analysis). For example, Falmouth ranks first nationally in terms of PTRE score, yet Folkestone & Dover, Barrow-in-Furness and Blackpool both sit in the bottom ten.